Trend detection and analysis
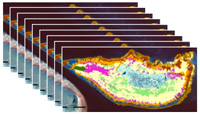
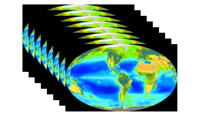
Trend detection and analysis compiles a large (> 10) number of image based maps of a biophysical parameter and subjects this to time series analysis techniques at the scale of individual pixels, lines of pixels or areas.
The analysis is used to identify periodicities (ie seasonal, monthly cycles) and trends. The data sets include biophysical parameters derived from:
- NOAA AVHRR = 27 years of weekly-monthly data
- Seawifs = 11 years of daily, weekly, monthly, seasonal, annual data
- MODIS = 8 years of daily, weekly, monthly, seasonal, annual data
Trend detection and analysis compiles a large (> 10) number of image based maps of a biophysical parameter and subjects this to time series analysis techniques at the scale of individual pixels, lines of pixels or areas. The analysis is used to identify periodicities (ie seasonal, monthly cycles) and trends.
The images or biophysical maps can be examined in a visual context using animations, or maps showing specific attributes of the time series
Quantitative time series analysis, to quantify periodicties and trends can be done using on-line tools or image processing software.
Example on-line tools include:
- Giovanni: is a Web-based application developed by the Goddard Earth Sciences Data and Information Services Centre (GES DISC) that provides a simple and intuitive way to visualize, analyze, and access vast amounts of Earth science remote sensing data without having to download the data.
- PO.DAAC: NASA's Physical Oceanography Distributed Active Archive Center